Financial Plan Overview
The Financial Plan Overview report shows a summary of figures for one or more financial plans.
Parameters
- Financial plan - The report displays the selected plans. Note that if multiple plans are selected, their figures are merged together.
- Year - This determines the years shown in the report. The options are Year 1 to 5, not specific contract years, and this is relative to the earliest selected plan. For example, if you select a 2015/16 plan and a 2017/18 plan, year 1 would be 2015/16 and year 5 would be 2019/18, even if the later plan has data going up to 2021/22.
- Item grouping - This determines whether the report groups by funding line type or cohort groups.
- Funding type/cohort group - This filters by the selected items. The list of items will either be funding line types or cohort groups depending on the item grouping parameter.
- Payment type - This filters by the selected payment types.
- Show “what if” / current values - This determines whether the report shows “what if” figures, current (i.e. actual) figures or both.
Layout
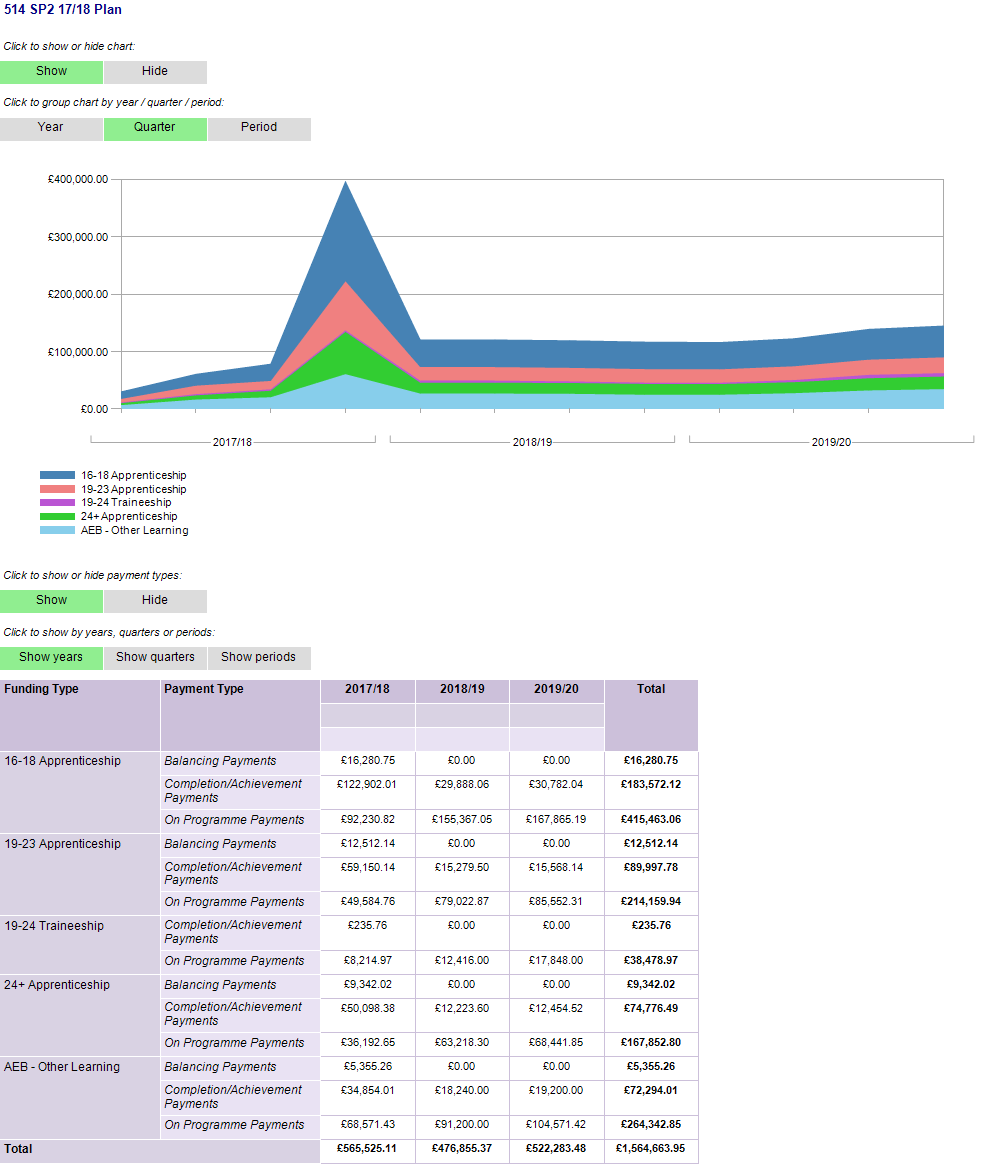
The report shows an area chart of finance over time based on the selected plans and years. Each area relates to a funding type or cohort group, depending on the item grouping parameter. There are buttons above the report to hide or show it and to group the chart by period, quarter or year (the default is quarter).
Underneath the chart is a table of the corresponding figures by funding type or cohort group. There are buttons to show/hide the payment type and to show figures by period, quarter or year (the default is year).
Clicking on a figure will show a list of the funding rows which comprise that figure.
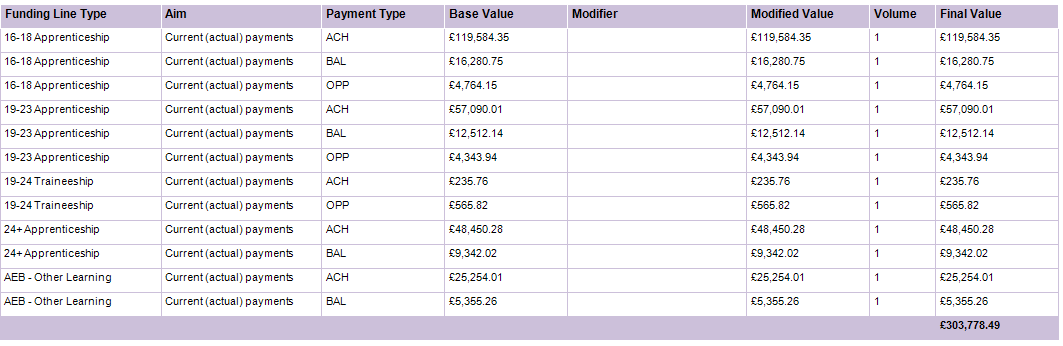
For rows with an aim of Current (actual) payments, clicking on the Final Value figure will show a list of payments by learner which comprise that figure.
